North American aviation industry by numbers - the latest trends and data

Routesonline analyses the North American aviation industry, taking a monthly look at the top routes served and revealing the airlines that are dominating the market. We also rank the top ten airports by available departure seat capacity.
Q3 2018 - All data provided by OAG Schedules Analyser
Top North American airline routes
Los Angeles (LAX) - San Francisco (SFO) had the largest number of two-way seats during the third quarter of 2018 at 1,269,442, as capacity nudged up by 0.7 percent year on year. The route is operated by five carriers (Alaska Airlines, American Airlines, Delta Air Lines, Southwest Airlines and United Airlines), with United commanding the largest share of the market by capacity (31.6 percent).
Vancouver (YVR) to Calgary (YYC) recorded the largest year-on-year rise in available seat capacity in the top ten, growing by 20.2 percent to be ranked tenth (up from 21st during Q3 2017). Flair Airlines began operating the route in June 2018, which has prompted WestJet and Air Canada to increase frequencies.
Top five routes by capacity (Q3 2018 vs Q3 2017):
https://infogram.com/top-5-na1-routes-by-capacity-in-q3-2018-1hnq411mpx…
Top North American airlines
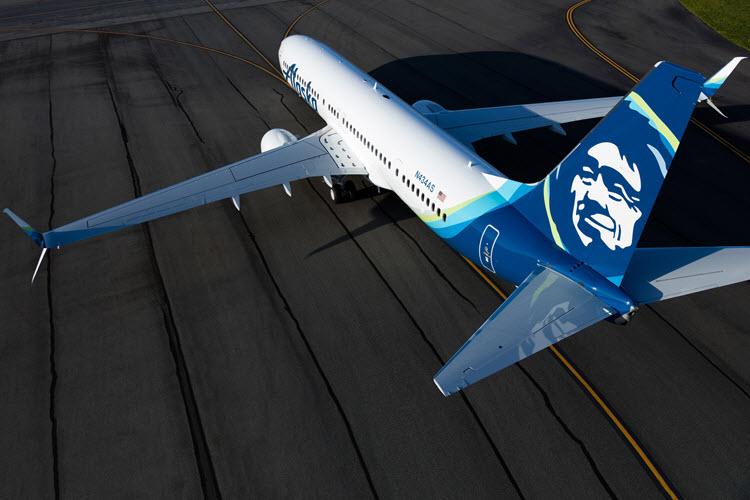
All airlines in the top ten increased year-on-year seat capacity during Q3 2018, with Alaska Airlines recording the largest percentage rise. The growth for Alaska Airlines largely stems from the integration of Virgin America, which the carrier bought in December 2016. Low-cost carriers Spirit Airlines and Frontier Airlines also enjoyed double-digit percentage rises, growing capacity by 15.5 percent and 17.9 percent respectively.
Total number of available seats by airline (Q3 2018 vs Q3 2017):
https://infogram.com/airlines-available-seats-in-q3-2018-1h9j6qwro8wv6gz
Top North American airports
Atlanta Hartsfield-Jackson added more than 500,000 departure seats in Q3 2018, compared with the same quarter last year. The growth of 3.3 percent outpaced that of the other airports featuring in the top five. Los Angeles International increased its total number of departure seats by 2.5 percent, Chicago O'Hare by 2.8 percent, Dallas/Fort Worth by 2.8 percent, and New York J F Kennedy by 1.7 percent. Elsewhere in the top ten, Seattle-Tacoma recorded impressive growth of 7.7 percent after adding 591,035 departure seats.
Top five airports by total departure seats:
https://infogram.com/na1-airports-by-departure-seats-q3-2018-1h1749811v…
The full North American aviation industry data
Top ten North American routes by total available capacity (Q3 2018):
| Rank | Route |
Total two-way capacity (Q3 2018) |
Total two-way capacity (Q3 2017) |
Change (%) |
| 1 | LAX-SFO | 1269442 | 1260083 | 0.7% |
| 2 | YVR-YYZ | 1094057 | 1154478 | -5.2% |
| 3 | JFK-LAX | 1017747 | 1061177 | -4.1% |
| 4 | LGA-ORD | 1013101 | 1023543 | -1.0% |
| 5 | JFK-LHR | 1001810 | 945043 | 6.0% |
| 6 | LAX-SEA | 792402 | 885726 | -10.5% |
| 7 | LAX-ORD | 844070 | 869043 | -2.9% |
| 8 | LAS-LAX | 947163 | 865062 | 9.5% |
| 9 | YUL-YYZ | 771819 | 825549 | -6.5% |
| 10 | HNL-OGG | 655783 | 815609 | -19.6% |
Top North American airlines by total available departure seats (Q3 2018):
| Rank | Airline |
Total available departure seats (Q3 2018) |
Total available departure seats (Q3 2017) | Change (%) |
| 1 | American Airlines (AA) | 66501746 | 65343623 | 1.8% |
| 2 | Delta Air Lines (DL) | 62040152 | 59998286 | 3.4% |
| 3 | Southwest Airlines (WN) | 52939458 | 51873349 | 2.1% |
| 4 | United Airlines (UA) | 51218771 | 48484581 | 5.6% |
| 5 | Air Canada (AC) | 18127082 | 17180709 | 5.5% |
| 6 | Alaska Airlines (AS) | 15093008 | 11777750 | 28.1% |
| 7 | JetBlue Airways (B6) | 13151050 | 12693586 | 3.6% |
| 8 | Spirit Airlines (NK) | 9236086 | 7999996 | 15.5% |
| 9 | Westjet (WS) | 8297333 | 7814864 | 6.2% |
| 10 | Frontier Airlines (F9) | 6164960 | 5227200 | 17.9% |
Top North American airports by total available departure seats (Q3 2018):
| Rank | Airport | Total available departure seats (Q3 2018) | Total available departure seats (Q3 2017) | Change (%) |
| 1 | Atlanta Hartsfield-Jackson | 15631427 | 16148350 | 3.3% |
| 2 | Los Angeles International | 13409074 | 13749125 | 2.5% |
| 3 | Chicago O'Hare | 12965370 | 13324019 | 2.8% |
| 4 | Dallas/Fort Worth | 10399187 | 10685582 | 2.8% |
| 5 | New York JFK | 10062003 | 10234098 | 1.7% |
| 6 | Denver | 9466220 | 9822892 | 3.8% |
| 7 | San Francisco | 9367625 | 9378360 | 0.1% |
| 8 | Toronto Lester B Pearson | 7966368 | 8304175 | 4.2% |
| 9 | Seattle-Tacoma | 7645342 | 8236377 | 7.7% |
| 10 | Las Vegas McCarran | 7238420 | 7435834 | 2.7% |


