The number of scheduled flights operated to/from the Asia-Pacific region was up a healthy seven per cent in March 2012. But scratch beneath the surface of the headline figures and the OAG schedule data reveals a lot about the underlying trends in air traffic in Asia. With Routes Asia taking place in Chengdu in April 2012, this is a good time to examine where new capacity is being placed.
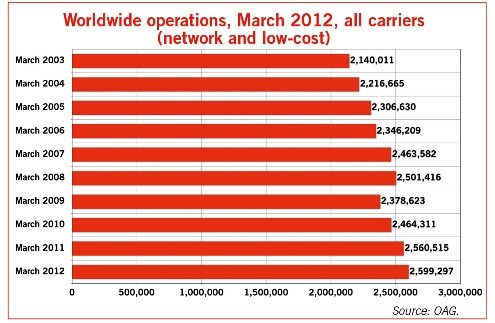
Not surprisingly, air transport growth across much of Asia-Pacific remains strong, especially compared with the more mature markets around the globe. It will have been a relief to many in the industry to see that, after a few difficult years, worldwide aircraft frequencies rose two per cent in March 2012 compared with a year earlier. The 2,599,297 aircraft operations scheduled to fly made March 2012 the busiest March on record.
But growth of two per cent masks an intra-European airline industry which is operating only as many aircraft as were flown in March 2006 and an intra-North American industry which has not yet returned to the levels of frequency which operated ten years ago.
Meanwhile, the opposite is true in Asia, both for operations within Asia-Pacific and for those connecting it with the rest of the world. The number of flights and seat capacity to and from Asia-Pacific rose by seven per cent and six per cent respectively, while within the region there were 41,018 more flights and 6,811,011 more seats available in March 2012 than last March, resulting in seven per cent more flight operations and seven per cent more offered seats.

Looking back at the number of aircraft operations in March over a 10-year period, it is clear that growth has been steeper both within Asia-Pacific and to/from Asia-Pacific than for aviation as a whole.
The number of aircraft operations flying to and from Asia-Pacific reached 66,800 in March 2012, more than double (+108 per cent) the volume of March 2003. But this is dwarfed by the scale of intra-Asia-Pacific aviation; there are 10 times as many aircraft operations within Asia-Pacific as to/from the region, and these grew by 77 per cent between March 2003 and March 2012 to reach 652,235.
More than half the growth in aircraft operations within the Asia-Pacific region has come from the low-cost sector. Whereas there were just 7,809 low-cost carrier (LCC) operations in March 2003, these have grown more than 20 times, so that in March 2012 a quarter of all operations, or 163,794 flights, were operated by LCCs. Low-cost carriers have made less impact on flights to/from Asia-Pacific, which are typically longer and use larger aircraft. Today, the proportion of flights operated to/from Asia-Pacific is only six per cent of the total, or 4,237 flights.
LCCs have made a huge impact in South Asia over the past 10 years. While total aircraft operations within South Asia have grown by a remarkable average annual growth rate of 11.3 per cent since March 2003, there were no low-cost carrier operations in 2003 in South Asia but today they contribute 54 per cent of all movements within the region. Network carriers, in contrast, have grown by an average two per cent each year.

The number of aircraft movements in South East Asia is almost double that of South Asia, and a similar picture of low-cost growth emerges from the OAG schedule data. The number of aircraft operations has grown at an average annual rate of 8.7 per cent, comprising a relatively stable period between March 2005 and March 2009 and then a surge in growth over the past three years. While network carriers have grown at an average rate of 1.5 per cent, low-cost carrier operations have averaged 46 per cent growth per annum and now make up 48 per cent of the total market.
In contrast, the much larger and more mature North East Asia market has grown more slowly, but steadily, and without the loss of frequencies in 2009 that occurred in South Asia and South East Asian aircraft operations. However, slower growth in North East Asia would be enviable growth elsewhere, as the sub-region has seen aircraft movements for the month of March grow at an average rate of 6.9 per cent over 10 years. Low-cost carrier activity has been much more subdued in this sub-region and LCCs only contributed 10 per cent of all frequencies in March 2012.
India is the primary air transport market in South Asia and the hubs at Delhi, Mumbai and Chennai handle a large portion of the traffic; each of these airports has grown rapidly over the past 10 years. Delhi, the largest with over four million scheduled seats in March, has grown at an average annual rate of 14.2 per cent since 2003. Mumbai, which is second largest with 3.7 million seats on offer, has grown at an average annual growth rate of 8.4 per cent, while Chennai has seen annual growth average 11.5 per cent.
However, a snapshot of capacity offered by scheduled airlines in the month of March over a 10-year period shows that the three airports are trending differently. Only Delhi appears still to be growing strongly; Chennai has seen faltering growth since 2008 and capacity at Mumbai may have plateaued.
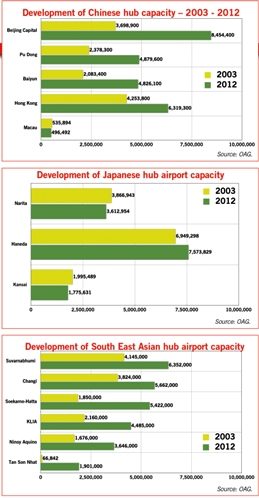
China and Japan are the major markets in North East Asia. In China, the three main hubs of Beijing, Shanghai and Guangzhou have averaged annual growth of between eight per cent and ten per cent since March 2003. Hong Kong has grown less quickly and Macau has seen a decline in capacity since it peaked in 2008. While there is a general consensus in the industry that air travel growth typically follows economic growth, the situation here is different. While Macau has seen its economy grow significantly faster than either mainland China or Hong Kong over the past decade, airport growth has been faltering. Instead, the hubs at Beijing, Shanghai and Guangzhou appear to be growing faster in order to catch up with the sheer size of the Chinese economy.
The long-standing economic tribulations of Japan are apparent in the growth in capacity at the Japanese hub airports – Narita, Haneda and Osaka. Both Osaka and Narita had less scheduled capacity in March 2012 than in March 2003, and growth at Haneda has averaged just one per cent per annum over almost a decade. With Japan returning to recession in 2011 following the tsunami, prospects for growth in airport capacity are looking slim.
Among the South East Asian hub airports, even the largest airports, which could be perceived as serving mature markets, continue to exhibit healthy growth. Bangkok has seen seat capacity rise by an average of 4.9 per cent per annum since 2003, while at Singapore average growth has been similar at 4.3 per cent.
The fastest growing hub has been Jakarta. While the Indonesian economy has grown at an average rate of 5.8 per cent since 2003, airport capacity growth has been more than double, at 12.7 per cent per annum and today there are more scheduled flights at Jakarta than Kuala Lumpur. Although starting from a much smaller operation, the airport at Ho Chi Minh has grown almost as fast, averaging 12.3 per cent per annum in terms of seats offered.
This story appears in the latest issue of Routes News. A copy of the latest issue of the world air service development magazine is available to all delegates at Routes Asia.


