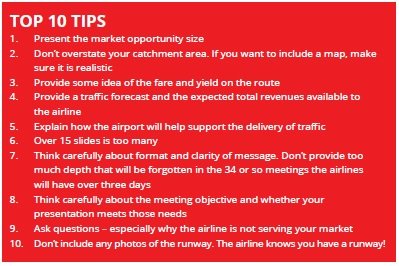
Do airlines really believe the catchment maps that are put in front of them at every Routes event? Or are they met with polite smiles and nods of agreement? If they are fabrication and not defensible, why include them? Surely by stretching the truth you risk undermining the very “circle of trust” that you are hoping to build with a potential customer. ASM has been asking airlines what they want to see in “the perfect presentation” and we have been honing this feedback through our own consultants who have worked as airline executives and sat across the other side of the table.
Airline requirements
ASM regularly asks the airline community what they would like to see included in a proposition from an airport or region. In an airline survey conducted by ASM, after the top pick of “Financial Support”, (well they would say that), came “Implementation and Actions” and “Market Information”. These top three areas should all be included in an airline presentation. It tells the airline an important story: what the market is and how much of it they will capture, as well as the total revenue opportunity; how the airport and region will help deliver passenger traffic for the airline; and how the airport and destination will share some of the risk of starting a new air service.
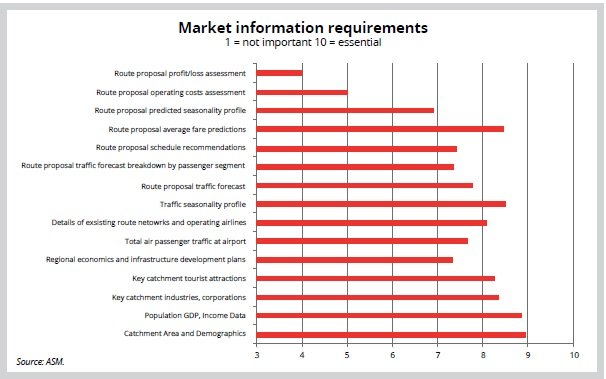
An airline’s investment in operating a new long-haul service can be over $100 million, so an appreciation of the cost is important. In terms of market information, the airlines highly rated catchment and demographics; population and GDP; and seasonality and fare. We would argue that the catchment area needs to be quantified with information and data with a realistic view on the market share an airline can expect from that catchment area.
It is believed that if you add up all the catchment areas provided by airports across the world, the global population would probably treble! Mike St Laurent, one of our consultants who was formerly with Air Canada for over 30 years, says “the danger with being unrealistic with your catchment area is that you risk losing their trust in the other aspects of your presentation”. It is also interesting that a route traffic forecast and a view on market segments is important, but a route profit/loss assessment (P&L) is ranked very low. Trying to tell an airline what their costs are is a high risk approach as it is almost impossible to understand every airlines’ accounting practises. You risk alienating the very people with whom you are trying to build a relationship. Don’t get into a debate the airline will know better than you.
So save the P&L for when there is an objection to be overcome. As one airline executive mentioned during the survey: “A profit [and] loss assessment is least important because the airline will calculate this on its own, using internal data; the airport or consultant’s data will not be as accurate, so it’s better for the airport to focus on and share other data about its market that is not generally available to the airline route planner.”

Bespoke approach
It is vital to remember that no two airline meetings or presentations are ever the same. The airline, environment, audience, time and stage of conversation all need to be taken into account. Some of these points may seem obvious but we frequently hear stories of airports and destinations not tailoring their offering and style to the meeting.
Obviously, network carriers, low cost carriers and charter carriers will all expect to hear radically different proposals. Also think of your audience and study the job title of the person you are meeting. If the job title is in procurement, the questions will be different from those of a network vice president or somebody involved in industry affairs. Each person will have their own interpretation of the requirements needed to serve a market.
A presentation at a Head Office may require a different approach to a meeting at an event and it is important to be clear where you are in the process and with the audience you are meeting. If the airline manager knows very little about your market it is an “introductory meeting”, if the business case has already been ratified then the discussion may move to “route support” or “traffic delivery”. If you have been having the same meeting year after year, focus on why the carrier is not serving your market, be it the level of corporate traffic or pulling together tour operator support. Closing the deal is one of the most difficult meetings and requires careful negotiation skills. There are many “do’s and don’ts” in this specific type of meeting.
Data and market size
The route development field is awash with rich data sources from country level passenger statistics, MIDT data and the even the emergence of online aggregator sites that can provide search data, such as Skyscanner. There is no excuse for not being able to estimate a route market size from your airport and deliver a traffic forecast. The presentation must include robust data and MIDT data is a language that all airlines understand. But it must be used correctly. Airports must accept that the data will always be a survey and assumptions will be made. Forecasts may use different techniques whether
it is QSI, Frequency Share or Market Share and may use different data to support an assumption. The important aspect to remember is that the forecast must be stress tested. Can it hold up to scrutiny?

Flow and format
Provide careful thought to your presentation flow and format, particularly in a Routes environment. Out of the 20 minutes, research has shown that only 13 minutes is spent discussing the opportunity, so don’t provide a 25-page presentation when you will have only 30 seconds per slide. The airline planner will have received over 34 presentations in two days, so focus on the market size, the forecast volume, the percentage of business traffic, or the average fare. Provide soundbites that can be supported with a more detailed document.
Given time constraints, one should organise the presentation in order of importance, followed by questions and answers. Start with a statement regarding opportunity and details about the expected market size, value and competitive benefits. Move through a traffic forecast, fare estimations and rankings against other competing markets, and then finish on how the traffic will be delivered.
Finally, don’t do all the talking and make sure you provide your view on the market opportunity and how it sounds to you. The format is probably the area where the technology and design will change how these presentations look and the medium upon which they are delivered. We believe that there are a range of formats for different types of meeting, ranging from A3 fold-out leaflet designs to an interactive tablet design powered by an integrated dataset. There is no reason why the latter should not be deliverable on a smartphone for those conversations that take place in a bar and not a boardroom.
The stakes are high for an airport or region. The direct revenue of a daily widebody flight can stretch to millions depending on aeronautical and nonaeronautical revenues, while the wider economic benefits to a region can be$8 million-plus. The more thought and expertise that goes into creating the perfect presentation, the greater the likelihood of success. That doesn’t necessarily mean including a detailed catchment map!


